How to Use an Optical Time Domain Reflectometer?
For fiber optic troubleshooting, the optical time domain reflectometer (OTDR) is the only tool that tells you exactly where a problem is—not just that something is wrong. By measuring backscattered light, it reveals fiber length, splice loss, connector reflections, and break locations.
This guide walks through how an OTDR works, practical operation steps, trace interpretation, and a time domain reflectometer price comparison across real-world models. Whether you need the function of OTDR in optical fiber networks or answers to common time domain reflectometry test questions, you’ll find them here.
How an Optical Time Domain Reflectometer Works and Key Specifications
Understanding both how a handheld optical time domain reflectometer fiber tester operates and its key specifications is critical for efficient optical fiber network troubleshooting. Mastering these fundamentals allows technicians to fully leverage advanced optical pulse testing, ensuring they can accurately interpret trace data, diagnose hidden faults, and select the right equipment for any field application.
How an Optical Time Domain Reflectometer Works
An Optical Time Domain Reflectometer (OTDR) is an instrument that analyzes backscattered light to evaluate fiber uniformity, defects, breaks, and connector performance. It operates on two core principles: Rayleigh scattering and Fresnel reflection.
- Rayleigh scattering: Rayleigh scattering occurs when light interacts with microscopic density fluctuations in the fiber core. A small portion of light scatters back to the OTDR, creating a continuous trace that reveals attenuation, splice loss, and loss distribution along the fiber length.
- Fresnel reflection: Fresnel reflection happens at points where the refractive index changes abruptly—such as connectors, mechanical splices, or fiber breaks. These events produce sharp spikes on the trace, enabling precise fault location.
By measuring the resulting curve, an optical time domain reflectometer provides essential data, including fiber attenuation, joint loss, fault positioning, and overall loss distribution, making it a critical tool for fiber optic construction, maintenance, and monitoring.
Which Key Metrics Matter Most?
To properly evaluate or configure an optical time domain reflectometer, field technicians must understand several core technical parameters. Selecting the correct criteria is essential not only for capturing precise trace results but also for successfully achieving Tier 2 certification.
| Metric | Core Function | Field Application Guide |
| Wavelengths (nm) | Defines laser-to-glass interaction and link attenuation. |
1310 nm: Best for finding localized splice anomalies. |
| Dynamic Range (dB) | Determines the total optical loss budget a device can handle. | Higher dB means longer range. A 32/30dB OTDR tester is required to map complex fiber links up to 100–160km. |
| Dead Zones (m) | Specifies the receiver's temporary physical blind spot. | Event Dead Zone (0.8m): Minimum gap to separate close adapters. Attenuation Dead Zone (4m): Minimum gap to measure splice loss. |
How to Use an Optical Time Domain Reflectometer Step by Step
Operating an optical time domain reflectometer requires a precise, systematic setup to guarantee accurate measurement data and prevent false link failures. Below is the field-tested, step-by-step workflow required to properly configure your OTDR tester and execute a successful Tier 2 certification scan.
| Step | Action | Key Notes |
| 1. Inspect & Clean Connectors | Check and clean all fiber connectors before testing | Use a fiber inspection probe and lint-free cleaner to remove dust and oil contamination. |
| 2. Connect the Launch Fiber | Connect a 100–500 m launch fiber between the OTDR and the fiber link | Reduces front-end dead zone and improves first-event measurement accuracy. |
| 3. Select the Test Mode | Choose Auto Mode or Manual Mode | Auto Mode is suitable for quick testing, while Manual Mode allows advanced parameter adjustment. |
| 4. Configure Testing Parameters | Set wavelength, range, pulse width, and averaging time | Use 1310/1550 nm for standard testing or 1625 nm for live FTTH testing. |
| 5. Run the Test & Save the Trace | Start the OTDR scan and save the results | Wait for the trace to stabilize and save the waveform in SOR format for future analysis. |
Quick-Reference: Parameter Configuration Guide
Proper optical time domain reflectometer parameter configuration is essential for obtaining accurate fiber optic testing results. The table below provides a quick reference for selecting the appropriate distance range, pulse width, and averaging time based on different fiber link lengths and testing scenarios.
| Cable Link Length | Recommended Distance Setting | Ideal Pulse Width Selection | Recommended Averaging Time |
| Short Jumpers (<1 km) | 1 km – 2 km | 3 ns – 10 ns (Ultra-Short) | 30 Seconds |
| FTTH Distribution (1 km – 20 km) | 30 km | 30 ns – 100 ns (Medium) | 60 Seconds |
| Long-Haul Trunk (50 km – 100+ km) | 150 km – 200 km | 500 ns – 2 μs (Long) | 120 – 180 Seconds |
How to Interpret Optical Time Domain Reflectometer Traces and Event Maps
Mastering trace interpretation is the most critical skill for successful optical fiber network troubleshooting. It allows you to unlock the full potential of your handheld OTDR and turn complex optical pulse testing data into actionable field fixes.
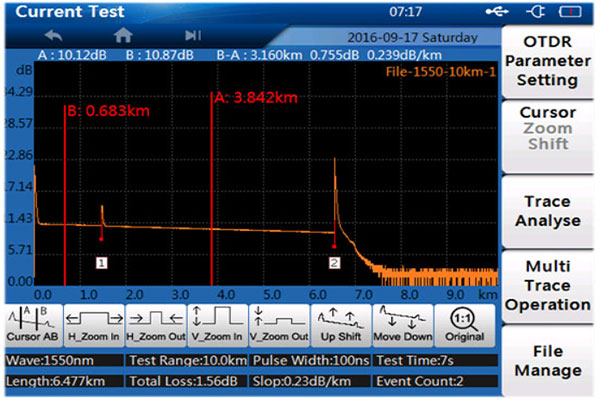
Understanding a Normal OTDR Trace
A normal OTDR trace shows a smooth, downward-sloping line (backscatter) with occasional sharp spikes and small steps. The slope represents fiber attenuation—steeper means higher loss per kilometer. Sharp upward spikes indicate Fresnel reflections from connectors or the fiber end, while downward steps represent splice losses or bends. The trace ends with a final reflection spike at the fiber’s far end.
Identifying Common Trace Abnormalities
- High noise (fuzzy trace): Caused by short averaging time or dirty connectors. The curve looks jagged instead of smooth.
- Ghost events: Extra spikes that repeat at regular intervals after a strong reflection. They are not real faults but artifacts.
- Excessive front-end dead zone: The first few meters show no data, hiding near-end connectors. This happens without a launch cable.
- Unexpected loss steps: A sudden downward step without a reflection spike often means a microbend or poor splice.
- No reflection spike at the fiber end: Could indicate a clean break, a badly angled cleave, or the fiber continues beyond the selected range.
How to Fix Each Issue
Even experienced technicians encounter trace anomalies. The table below lists the most common Optical Time Domain Reflectometer trace problems and their field-proven fixes.
| Problem | How to Fix |
|
Noisy trace |
Increase averaging time (30–60 seconds), clean all connectors, and ensure the fiber is not moving during the test. |
|
Ghost events |
Add an attenuator or a longer launch cable before the test. Reducing pulse width also helps. |
|
Front-end dead zone hides events |
Always use a launch cable (at least 300m for high-resolution testing) between the OTDR and the fiber under test. |
|
Unexpected loss step |
Inspect the fiber for tight bends, kinks, or debris in connectors. Re-clean and re-test. |
| Missing end reflection | Check that the range is set long enough to cover the entire fiber. If the fiber is broken, the trace will end with a non-reflective drop. |
|
Reflection spike too high (> -30dB) |
Clean the connector. High reflection often means a contaminated or damaged end-face. |
Pro Tip: Always compare the event map with the actual trace. Event maps automatically mark reflection and loss events, but manual inspection of the trace confirms whether an event is real or an artifact (like a ghost).
How to Choose an Optical Time Domain Reflectometer for Your Needs
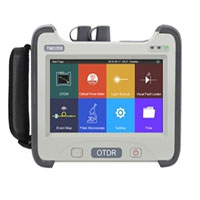
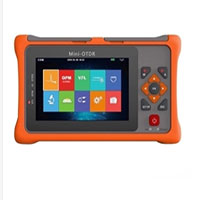
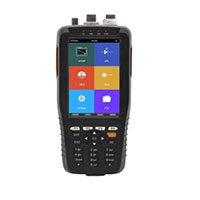
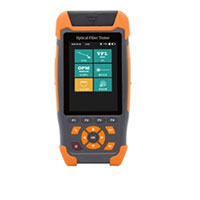
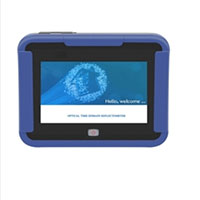
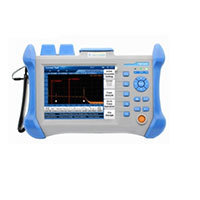
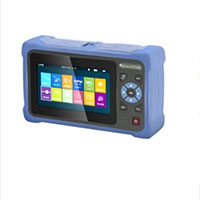
Use the table below to quickly compare ATO shop optical time domain reflectometer models by scenario, wavelength, dynamic range, and price, from budget-friendly field kits to long-haul and live-FTTH testers.
| User Scenario | SKU | Wavelength | Dynamic Range | Key Features |
| High performance (5-in-1) |
|
1310/1550nm | 32/30dB | 5-in-1, high-power VFL, near-end fault |
| Budget / First-time user |
|
1310/1550nm | 22/20dB | 9-in-1, touch screen, 70km |
| Handheld / Touch screen |
|
1310/1550nm | 24/22dB | 4″ touch, smart fault detection |
| Quick testing / 6-in-1 |
|
1310/1550nm | 22/20dB | 6-in-1, RJ45 test, no complex setup |
| Live FTTH (1625nm) |
|
1625nm | 20dB | 5″ HD touch, FTTH solution |
| Long-haul (120km) |
|
1310/1550nm | 30/28dB or 32/30dB | 5.6″ touch, multi-language |
| Outdoor / 12h battery |
|
1550nm | 24dB | OPM/VFL/OLS, RJ45, 12h battery |
FAQs of Optical Time Domain Reflectometers
Q1: What wavelength should I use for optical time domain reflectometer testing?
A: Use 1310nm and 1550nm for standard single-mode fiber testing. Use 1625nm for live FTTH (PON) testing without disrupting network traffic.
Q2: Why does an OTDR need a launch cable for an accurate time domain reflectometry test?
A: A launch cable overcomes the front?end dead zone, allowing the OTDR to see connectors and events near the start of the fiber.
Q3: What is the dead zone in OTDR testing, and how does it affect fiber fault location?
A: Dead zone is the distance after a strong reflection where the OTDR cannot see or measure nearby events. Event dead zone (~1m) and attenuation dead zone (~4-10m) are the two types.
Q4: Can an optical time domain reflectometer detect fiber breaks?
A: Yes. A break appears as a sudden drop in the trace to the noise floor, and the OTDR reports the exact distance to the break.